
Report Charts
Report Charts
Purpose and when to use this record
BriskTurn storesan advanced report chartsinto asa partchart ofby selecting label, value, grouping, sorting, series, and display options.
At a glance
-
Identify it by: Chart Title, Label Field, Label Subfield, and Show Values On Chart.
-
Check its business context: Standard Report, and Advanced Report.
-
Why care: A report is only trustworthy when its data source, date field, filters, grouping, and totals answer the
reportsintendedmodule.businessThisquestion.generated
Before you begin
You need the Brisk permission for the action you are taking on report charts. If a Create, Edit, or Delete control is awaitingabsent, workflowdo review.not work around it with another user’s account; ask an administrator to review your role.
Create a recordReport Chart
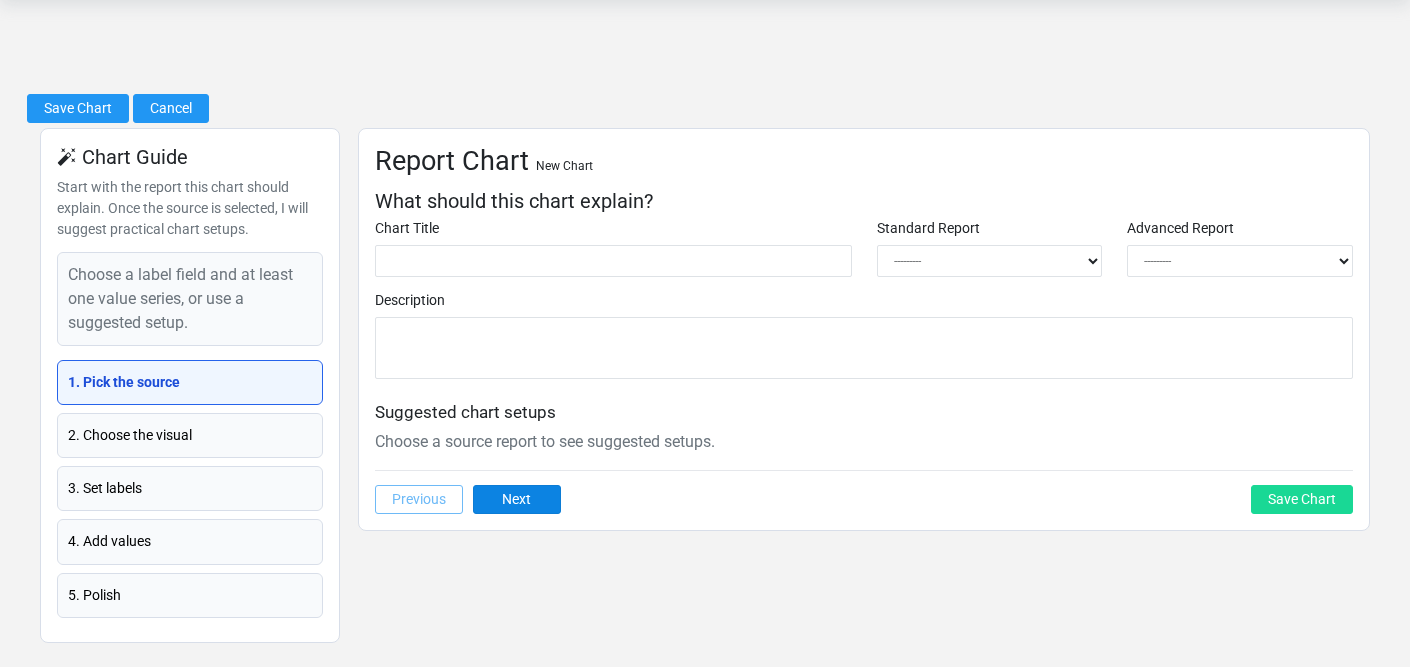
TheCreate evidencea packetReport identifiesChart after searching for the viewperson, organization, item, location, or resource under alternate names and sourceidentifiers. locationMerge or correct an existing master record instead of creating a duplicate.
-
Select the business context first: Standard Report, and Advanced Report.
-
Enter the required identifying and operational values: Chart Title.
-
Review System Chart, Chart Type, Time Grouping, Sort, Stack Series, and Show Legend, plus the remaining screen fields deliberately; these choices control availability or workflow rather than merely describing the record.
-
Save the Report Chart, then confirm Chart Title, Label Field, Label Subfield, and Show Values On Chart on its detail page before continuing.
After saving: Verify this Report Chart in Chart Series before staff build new activity on it; correct ownership, classification, and active state now rather than after transactions accumulate.
Delete a Report Chart
Delete this Report Chart only if it is an unused duplicate or setup mistake. Once other records refer to it, preserve that history and make the value inactive when the screen provides that option.
Before confirming, check for thisrelated action.Chart ConfirmSeries. user-facingBrisk stepsmay beforerefuse approvingdeletion when another record depends on this page.one; resolve the duplicate or use the supported correction workflow instead of breaking the trail.
On the confirmation page, verify Chart Title, Label Field, Label Subfield, and Show Values On Chart. After confirmation, return to the Report Charts list and make sure only the intended Report Chart was removed.
ViewReview recordReport Chart details
The evidence packet identifiesUse the viewdetail page as the shared record of what this Report Chart currently means. Verify Chart Type, Time Grouping, Sort, and sourceColor locationPalette before relying on it for a decision.
Follow Standard Report, and Advanced Report to determine whether the issue is on this action.Report ConfirmChart user-facingor stepson one of those linked records.
Next check: Verify this Report Chart in Chart Series before approvingstaff build new activity on it; correct ownership, classification, and active state now rather than after transactions accumulate.
Edit an existing Report Chart
Edit this Report Chart to keep the same real-world party, item, location, or resource accurate. Do not repurpose it for a different entity after activity is attached.
-
Open the detail page. Compare Standard Report, and Advanced Report with the supporting document or approved request.
-
Recheck Chart Type, Time Grouping, Sort, and Color Palette. These values are most likely to change the population, date range, grouping, and totals users see.
-
Save the change, return to the list, and confirm that the Report Chart now appears under the expected Chart Type, Time Grouping, Sort, and Color Palette.
After the change: Verify this Report Chart in Chart Series before staff build new activity on it; correct ownership, classification, and active state now rather than after transactions accumulate.
Find and review recordsreport charts
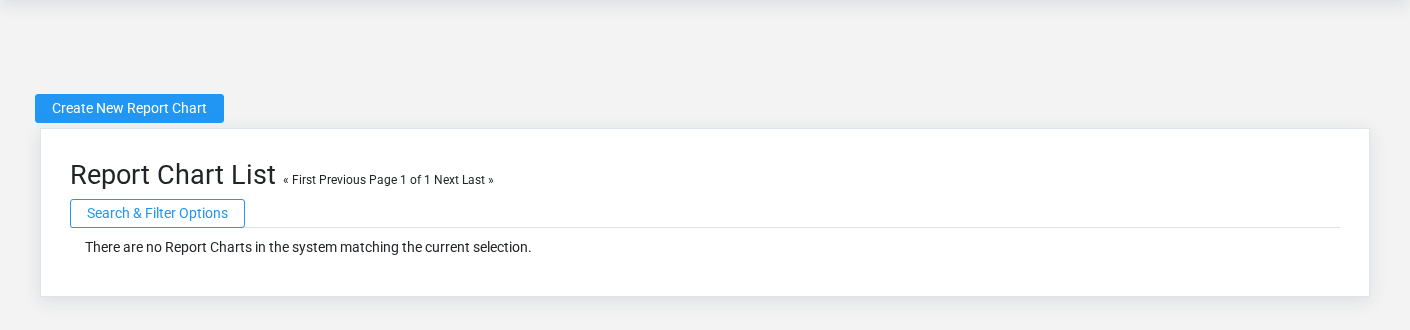
The evidence packet identifiesUse the viewReport Charts list to find the correct record before opening or changing it. Compare Chart Title. Records with similar names or numbers can still belong to different Standard Report, and sourceAdvanced locationReport.
- The initial order emphasizes Chart Title. Select a column heading when you need a different comparison.
Open the Report Chart whose Chart Title match the task. If it is missing, clear the list filters and recheck Chart Type, Time Grouping, Sort, and Color Palette rather than creating a replacement immediately.
Fields and business rules
Brisk stores 18 user-relevant fields for this action.Report ConfirmChart, user-facingincluding steps2 beforelinked-record approvingselections and 4 controlled-choice fields. Create and edit screens may hide calculated or workflow-managed values from this page.full reference.
Edit
| Field | Required | What |
|---|---|---|
| Chart Title | Yes | Human-readable name for this |
| Description | No | Description of this
|
| Standard Report | No | The |
| Advanced Report | No | The advanced report associated with this report chart. |
| Display Order | No | The display order value recorded for this |
| System Chart | No | Charts provided by Brisk can be copied but not modified by standard users. |
| Chart Type | No | The chart type recorded for this report chart. Available values: Bar, Horizontal Bar, Line, Area, Pie, Doughnut, Polar Area, Radar. |
| Label Field | No | Field used for labels. For dates, combine this with Time Grouping. |
| Label Subfield | No | The label subfield recorded for this report chart. |
| Time Grouping | No | Group date or datetime label fields into reporting periods. Available values: No Time Grouping, Day, Week, Month, Quarter, Year. |
| Sort | No | The sort recorded for this report chart. Available values: Source Order, Label A-Z, Label Z-A, Smallest Value, Largest Value. |
| Maximum Labels | No | Limits long charts and groups the remainder into Other where possible. |
| Stack Series | No | Whether the stack series option applies to this report chart. |
| Show Legend | No | Whether the show legend option applies to this report chart. |
| Start Axis At Zero | No | Whether the start axis at zero option applies to this report chart. |
| Show Values On Chart | No | Whether the show values on chart option applies to this report chart. |
| Chart Height | No | The chart height value recorded for this report chart. |
| Color Palette | No | The color palette recorded for this report chart. Available values: Business, Finance, Inventory, High Contrast. |
What happens next
Verify this Report Chart in Chart Series before approvingstaff thisbuild new activity on it; correct ownership, classification, and active state now rather than after transactions accumulate.
Common mistakes and troubleshooting
-
The record will not save: Recheck Chart Title and any message beside the field. A required related record may also be inactive or unavailable to your role.
-
The values look right but the result is wrong: Open Standard Report, and Advanced Report from the detail page. Correct the specific relationship that is wrong instead of forcing a total or status to compensate for it.